
- Corporate Governance and Compliance
- Involvement with Patients
- Relationship with Environment
- Involvement with Society
- Involvement with Employees
Key data on Sustainability (Governance, Environment, Social). See notes below table for the scope of data.
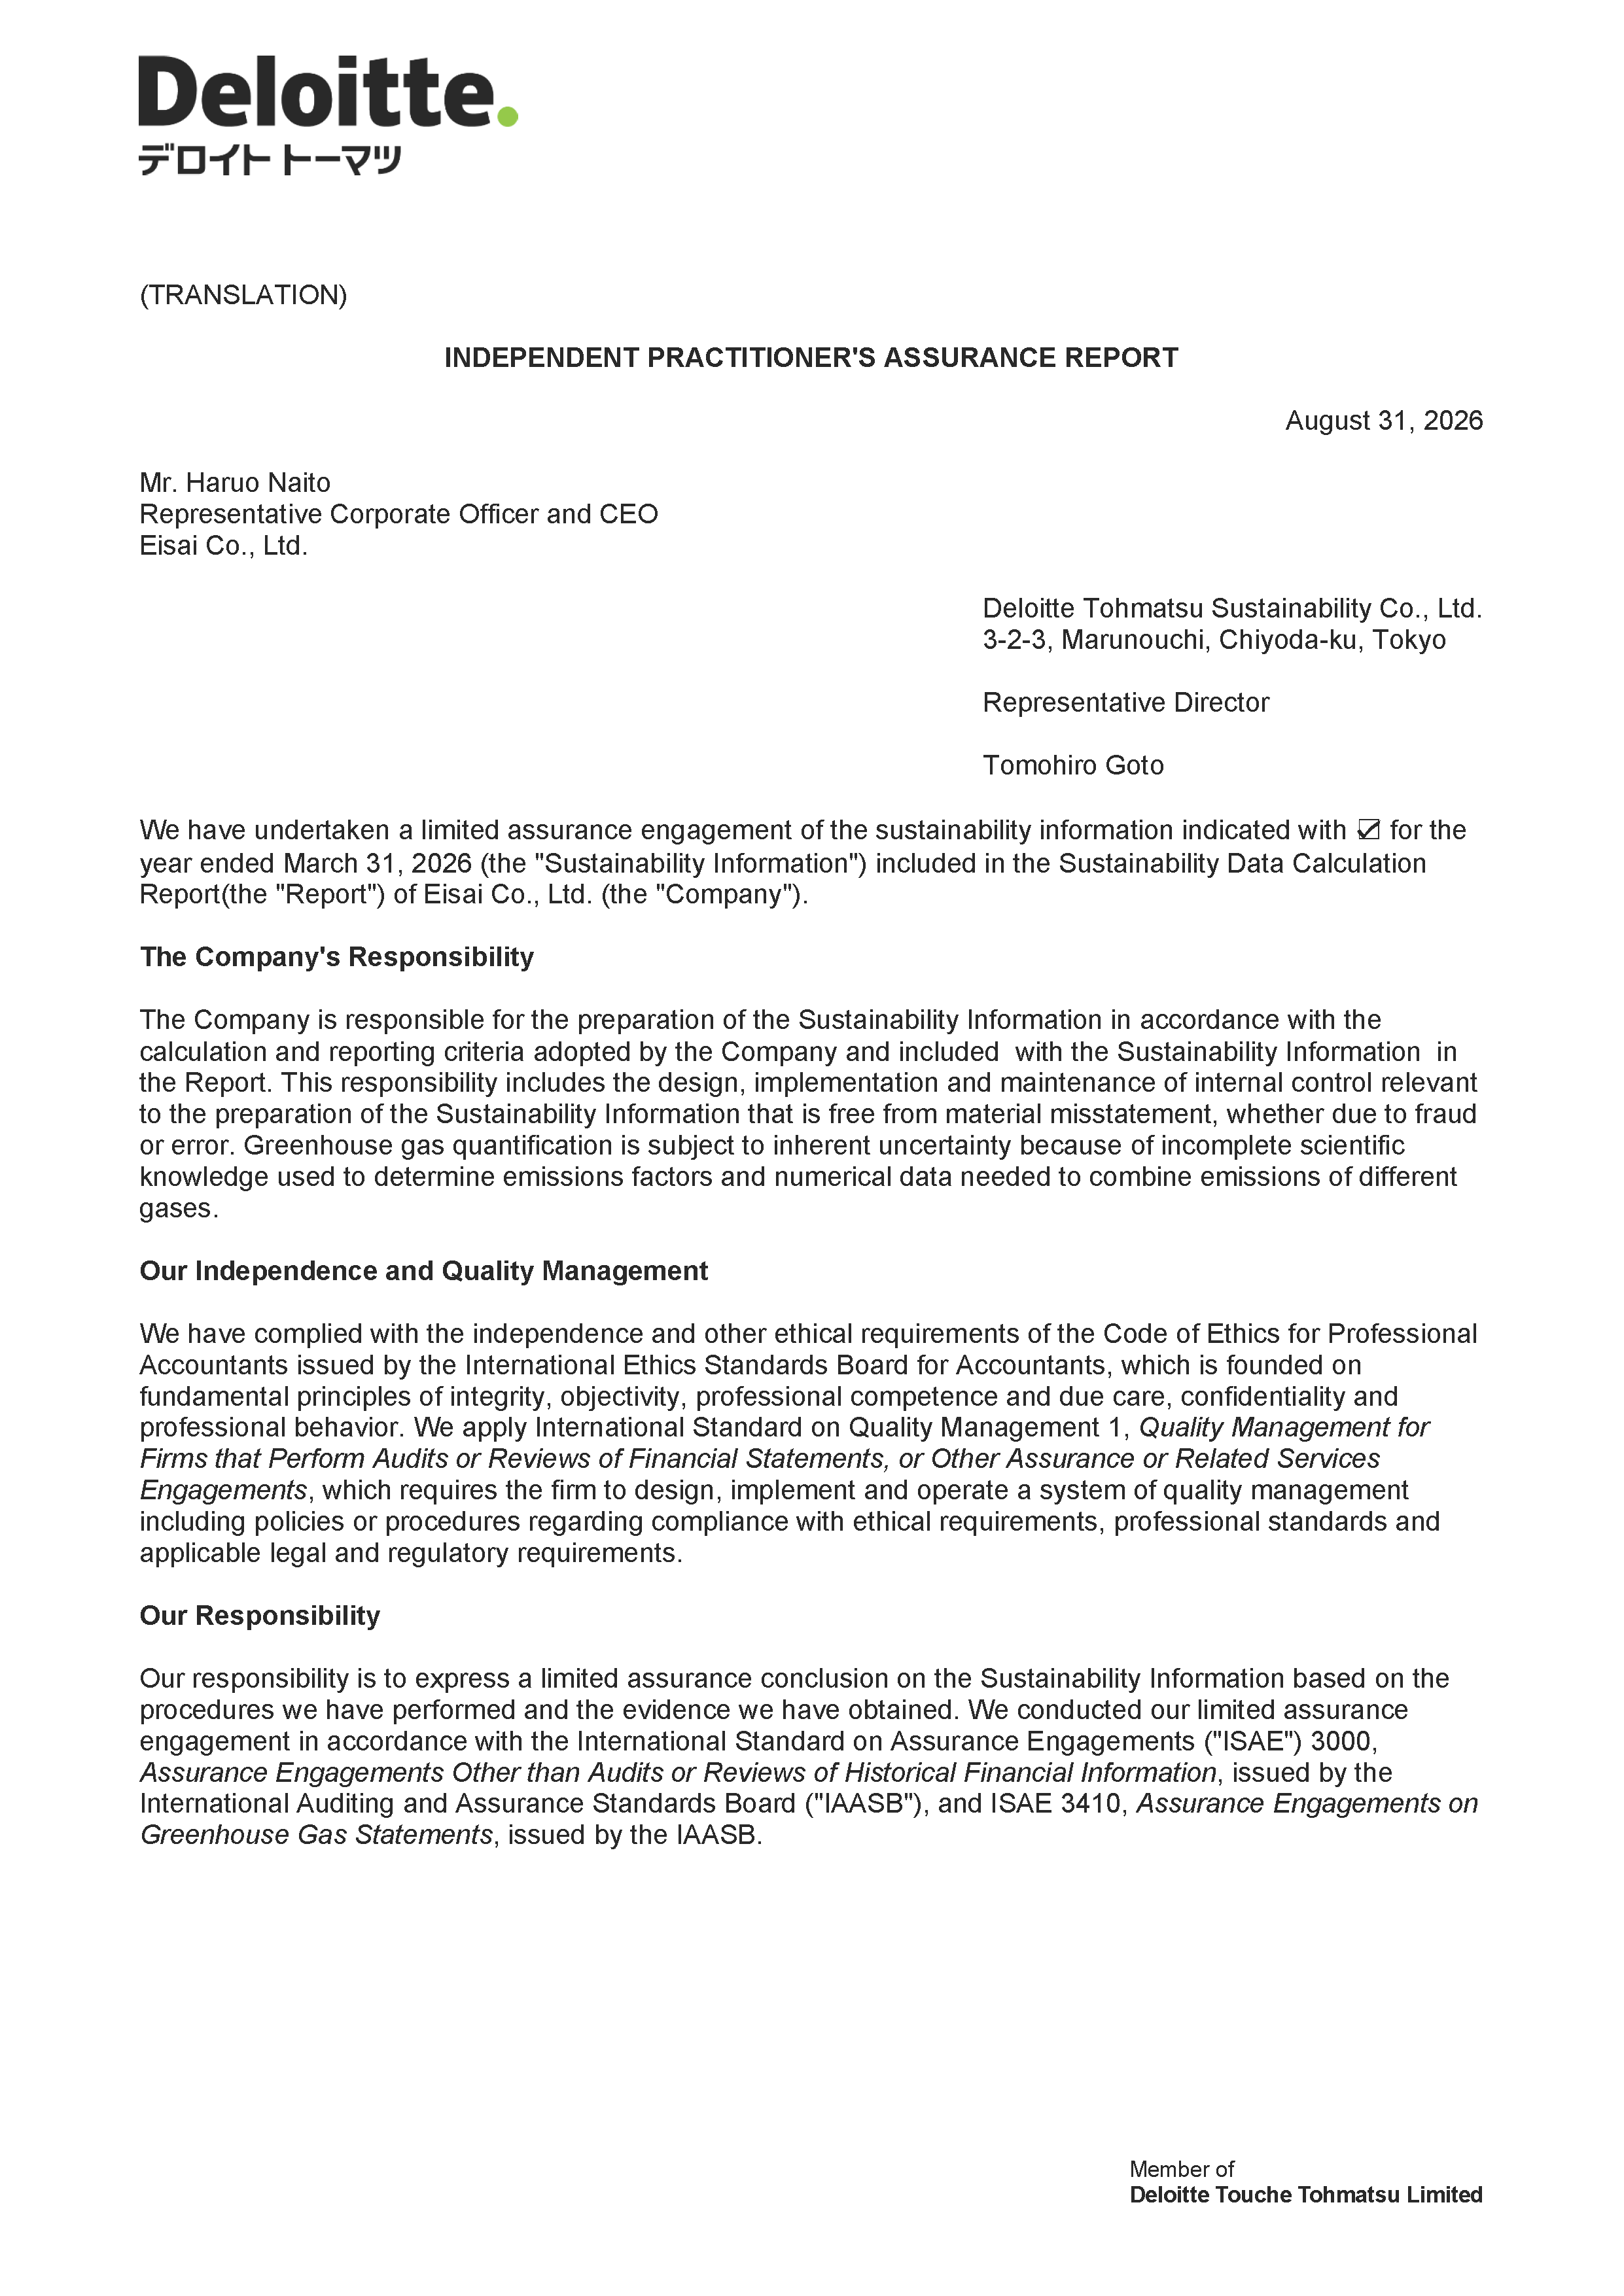
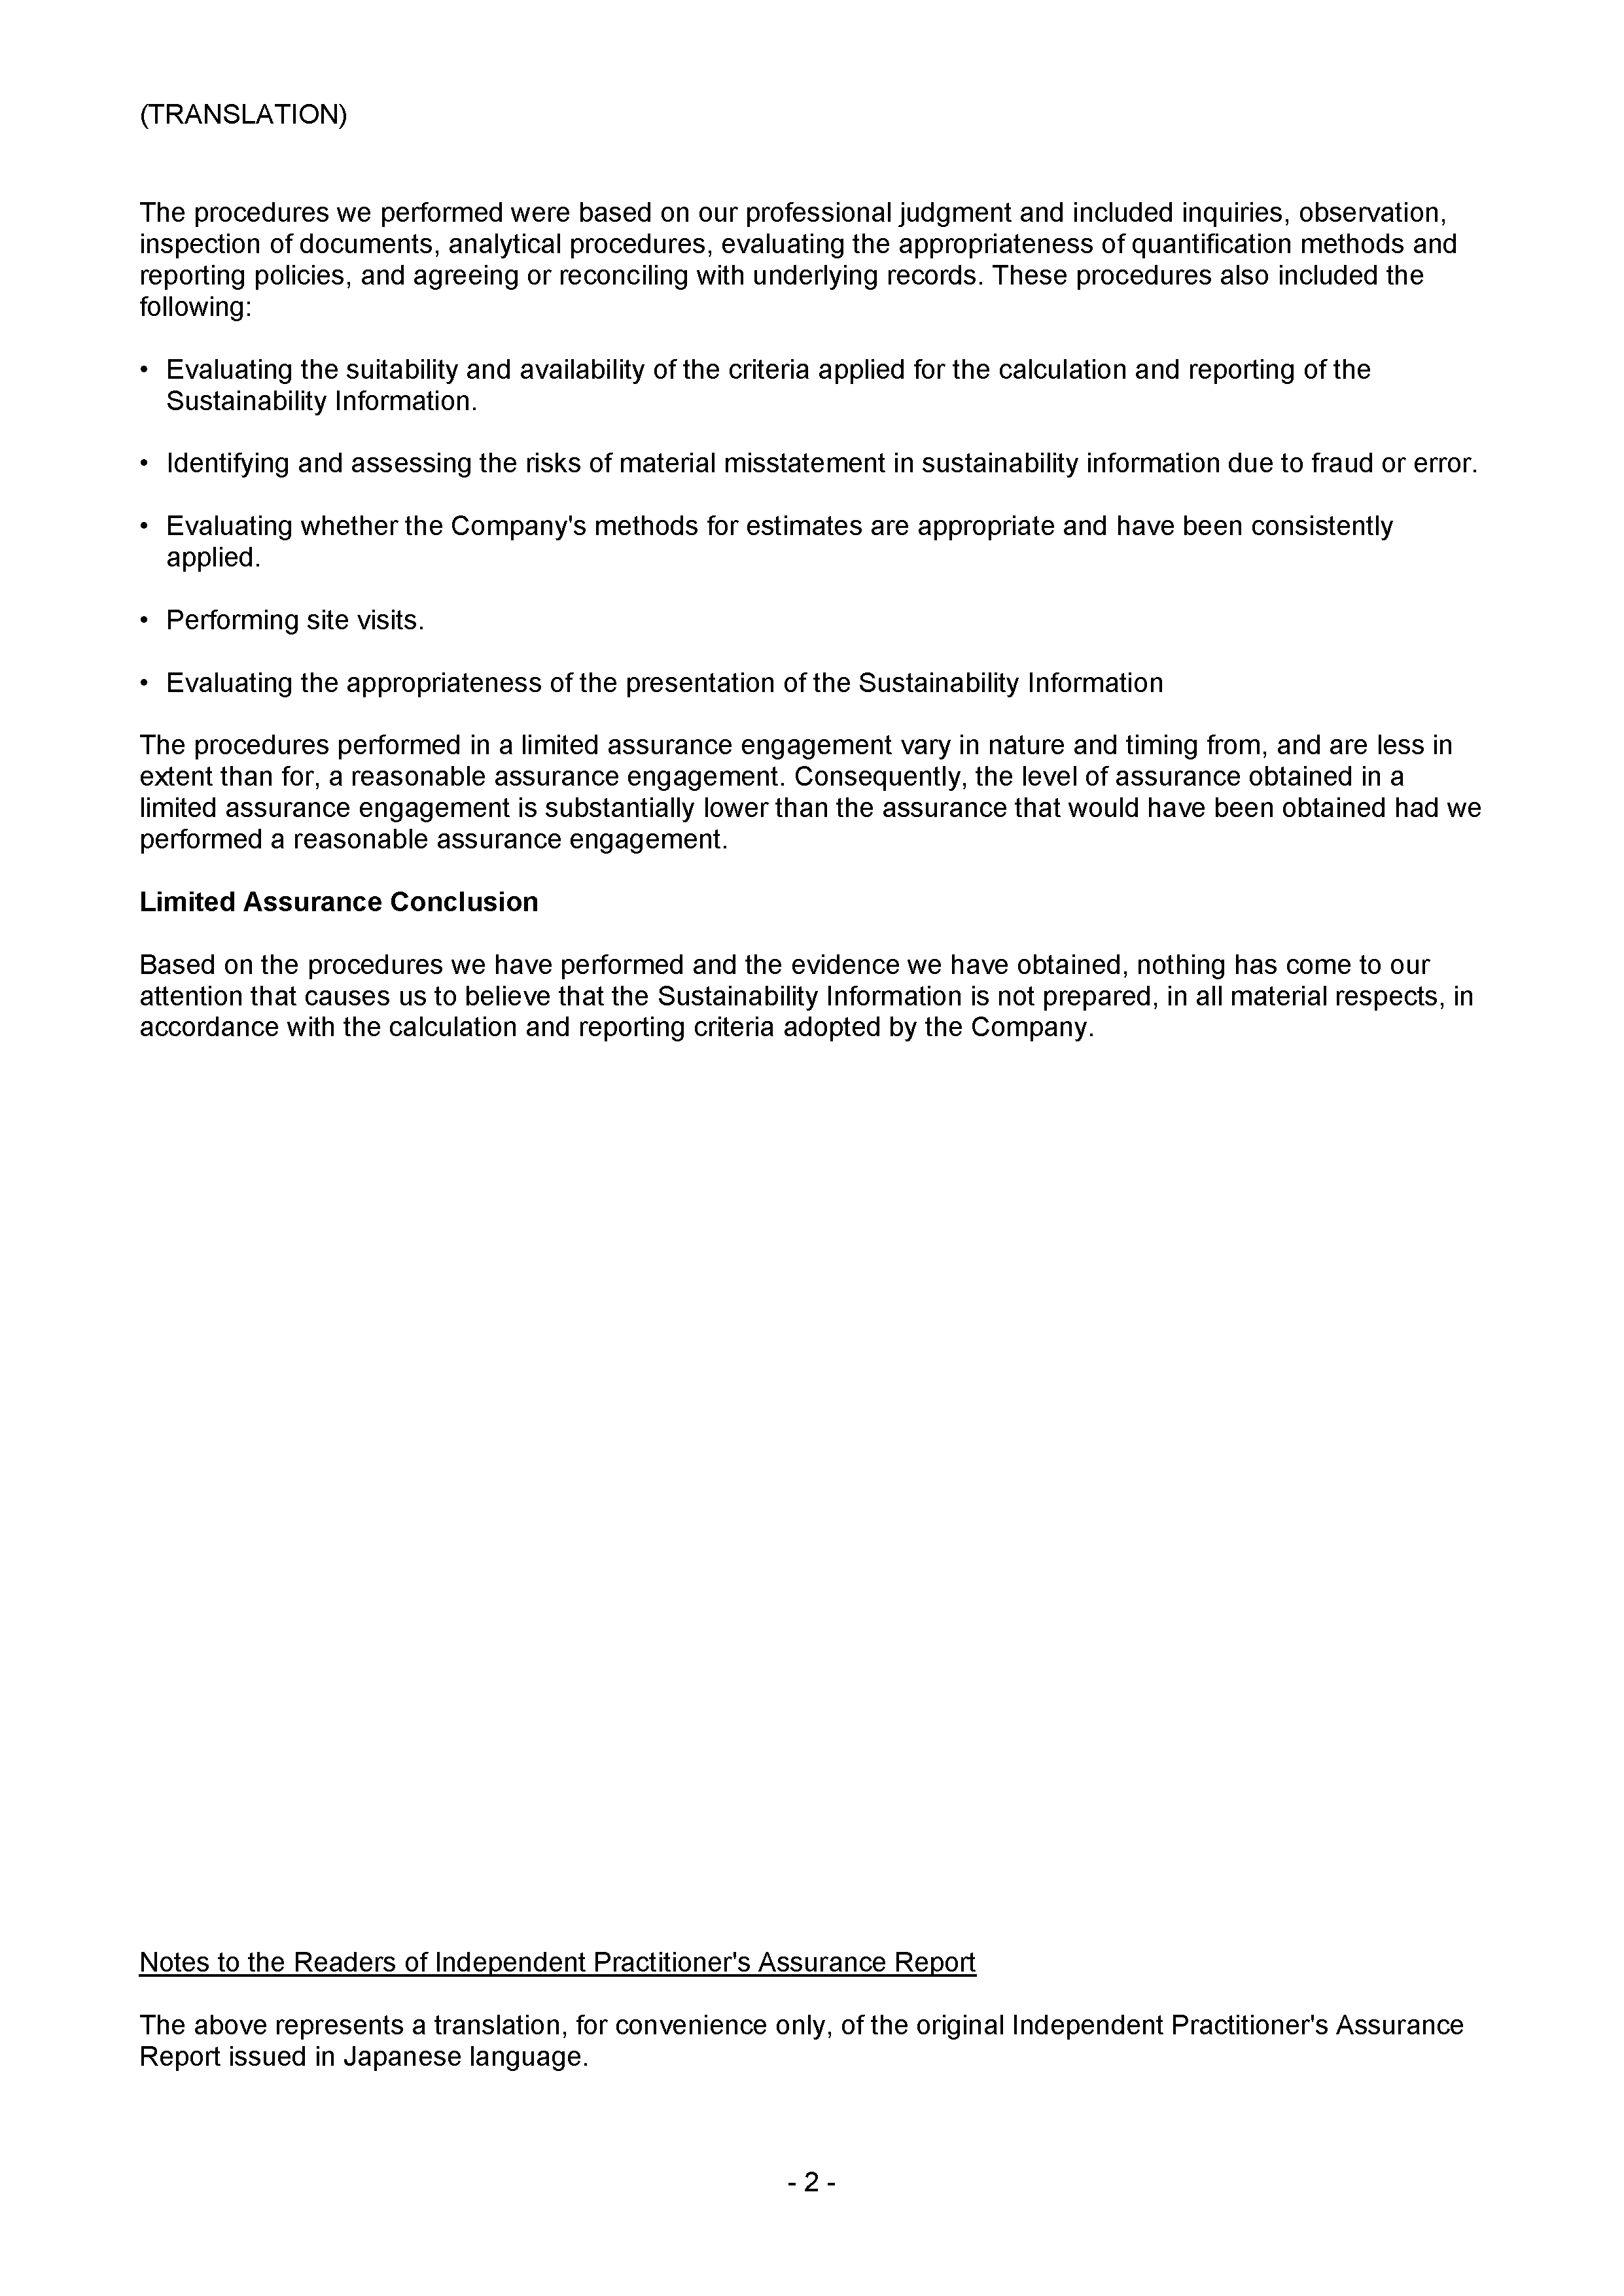
Information marked with an asterisk ☑ have received independent assurance.
The original "Independent Assurance Report“ is written in Japanese.
Please see the Japanese version for details.
Corporate Governance and Compliance
*You can scroll left and right
| Corporate Governance and Compliance | Scope of data*1 | Unit | Period | FY2021 | FY2022 | FY2023 | FY2024 | FY2025 | |
|---|---|---|---|---|---|---|---|---|---|
| Ratio of outside directors to directors (Outside directors/Directors) |
Global | Persons | At fiscal year end | 66.7% 8/12 |
63.6% 7/11 |
63.6% 7/11 |
63.6% 7/11 |
66.7% 8/12 |
|
| Ratio of female directors to directors (Female directors/Directors) |
Global | Persons | At fiscal year end | 8.3% 1/12 |
9.1% 1/11 |
18.2% 2/11 |
18.2% 2/11 |
18.2% 2/11 |
|
| Ratio of female corporate officers to corporate officers (Female corporate officers/Corporate officers) |
Global | Persons | At fiscal year end | 13.8% 4/29 |
18.2% 4/22 |
14.3% 3/21 |
15.0% 3/20 |
15.8% 3/19 |
|
| Average age of corporate officers | Global | Years old | At fiscal year end | 54.7 | 55.4 | 56.2 | 56.4 | 55.8 | |
| Compensation (Base compensation, bonuses and retirement allowances) |
Directors (inside) | Global | Millions of yen | At fiscal year end | 113 | 113 | 129 | 131 | 131 |
| Directors (outside) | Global | Millions of yen | 103 | 97 | 134 | 141 | 139 | ||
| Corporate officers | Global | Millions of yen | 1,180 | 1,004 | 1,164 | 1,092 | 1,057 | ||
| Compliance training | Number of times offered | Eisai Co., Ltd. | Times | Annually | 89 | 111 | 140 | 132 | 132 |
| Number of executive training courses | Eisai Co., Ltd. | Times | 2 | 1 | 1 | 1 | 1 | ||
| Totall participants (approx.) | Eisai Co., Ltd. | Persons | 6,000 | 8,300 | 13,100 | 9,844 | 9,062 | ||
| Submission rate of compliance oath | Global | % | At fiscal year end | 100.0% | 100.0% | 100.0% | 100.0% | 100.0% | |
| Human rights training | Number of times offered | Eisai Group in Japan | Times | Annually | 15 | 14 | 12 | 10 | 10 |
| Participants | Eisai Group in Japan | Persons | 5,295 | 5,147 | 4,946 | 5,410 | 1,764 | ||
|
Discrimination/ |
Eisai Group in Japan | Incidents | At fiscal year end | - | - | 8 | 7 | 5 | |
| Bribery and Corruption | Global | Incidents | At fiscal year end | - | - | 0 | 0 | 0 | |
| Number of cases subject to investigation by the authorities due to violation of anti-corruption acts* | Global | Incidents | At fiscal year end | 0 | 1 | 1 | 0 | 0 | |
| Number of employee disciplinary dismissals due to violation of anti-corruption acts* | Global | Incidents | At fiscal year end | 0 | 0 | 0 | 0 | 0 | |
| Fines, penalties and costs of settlement related to violation of anti-corruption acts* | Global | Yen | At fiscal year end | 0 | 0 | 0 | 0 | 0 | |
-
*The U.S. Foreign Corrupt Practices Act (FCPA), the U.K. Bribery Act, the Unfair Competition Prevention Act in Japan, etc.
Involvement with Patients
*You can scroll left and right
| Involvement with Patients | Scope of data*1 | Unit | Period | FY2021 | FY2022 | FY2023 | FY2024 | FY2025 | |
|---|---|---|---|---|---|---|---|---|---|
| Number of patents (number of patent applications) | Global | Items | Annually | 78 | 76 | 45 | 55 | 59 | |
| Product Recalls Class I |
Global | Incidents | Annually | - |
0 |
0 |
0 |
0 |
|
| Class II | Incidents | - | 1 | 1 | 0 | 0 | |||
| Number of inquiries to hhcHotline | Eisai Co., Ltd. | Incidents | Annually | 55,643 | 43,436 | 45,364 | 51,070 | 49,146 | |
| Number of inquiries posted on the website | Eisai Co., Ltd. | Incidents | 3,305 | 1,470 | 2,989 | 3,318 | 6,665 | ||
Relationship with Environment
*You can scroll left and right
| Relationship with Environment *1 | Scope of data | Unit | FY2021 | FY2022 | FY2023 | FY2024 | FY2025 | |
|---|---|---|---|---|---|---|---|---|
| Greenhouse gas | Greenhouse gas emissions (scope 1) | Global | t-CO2 | 46534 | 47507 | ☑48586 | ☑45666 | ☑38980 |
| Greenhouse gas emissions (scope 2, market standard method)*2 | Global | t-CO2 | 27967 | 6105 | ☑2673 | ☑3921 | ☑4927 | |
| Greenhouse gas emissions (scope 3, category1)*3 | Global | t-CO2 | ☑521809 | ☑602655 | ☑563928 | ☑825382 | ☑759554 | |
| Greenhouse gas emissions from headquarters and major manufacturing and research sites (scope 1) | Global (Headquarters, Plants and Laboratories) |
t-CO2 | ☑36182 | ☑36417 | 36425 | 31550 | 26452 | |
| Greenhouse gas emissions from headquarters and major manufacturing and research sites (scope 2) | Global (Headquarters, Plants and Laboratories) |
t-CO2 | ☑24824 | ☑5039 | 2574 | 3397 | 4646 | |
| Energy consumption | Total non-renewable energy consumption | Global | MWh | 315397 | 264087 | 259027 | 262839 | 232250 |
| Total renewable energy consumption | Global | MWh | 110408 | 169380 | 174060 | 176279 | 190329 | |
| Water *4 | Water intake |
Global | 1000 ㎥ | 3220 | 3982 | ☑3415 | ☑3168 | ☑3146 |
| Water supply | Global | 1000 ㎥ | 493 | 666 | 533 | 528 | 552 | |
| Surface water (lakes, rivers, etc.) | Global | 1000 ㎥ | 142 | 120 | 121 | 111 | 103 | |
| Groundwater | Global | 1000 ㎥ | 2573 | 3183 | 2746 | 2514 | 2476 | |
| Others *5 | Global | 1000 ㎥ | 12 | 13 | 14 | 15 | 15 | |
| Wastewater | Global | 1000 ㎥ | 2923 | 2591 | ☑2610 | ☑2455 | ☑2321 | |
| Total consumption | Global | 1000 ㎥ | 298 | 1391 | 805 | 713 | 825 | |
| Water intake at major manufacturing and research sites | Global (Plants and Laboratories) |
1000 ㎥ | ☑3194 | ☑3777 | 3347 | 3064 | 3069 | |
| Wastewater at major manufacturing and research sites | Global (Plants and Laboratories) |
1000 ㎥ | ☑2898 | ☑2505 | 2542 | 2354 | 2249 | |
| Waste | Amount of waste generated | Global | t | 5828 | 6037 | ☑5837 | ☑5222 | ☑5484 |
| Total waste recycled and reused | Global | t | 4203 | 3891 | 3601 | 3322 | 3327 | |
| Landfill waste | Global | t | 124 | 139 | 155 | 155 | 139 | |
| Waste generated at major manufacturing and research sites | Global (Plants and Laboratories) |
t | ☑4858 | ☑5522 | 4621 | 4889 | 4961 | |
| Hazardous Waste | Amount of waste generated | Global | t | 547 | 436 | 264 | 353 | 335 |
| Total waste recycled and reused | Global | t | 356 | 29 | 21 | 108 | 64 | |
| Landfill waste | Global | t | 7 | 1 | 1 | 0 | 0 | |
| Number of administrative actions and lawsuits related to the environment | Global | Incidents | 0 | 0 | 0 | 0 | 0 | |
-
*1Major manufacturing and research sites are as follows. Please note that the figures from FY2020 to FY2022 are aggregated from 14 major sites. From FY2023 onward, the figures are aggregated from the following 13 major sites.
Kawashima Industrial Park, Tsukuba Research Laboratories, Kobe Research Laboratories, EA Pharma Fukushima Plant, Suzhou Plant (China), Benxi Plant (China), Bogor Plant (Indonesia), Vizag Site (India), EMEA Knowledge Center (UK), Exton Site (U.S.), Baltimore Plant (U.S.), G2D2 (U.S.) -
*2Regarding electricity, we are working to increase our renewable energy ratio by utilizing non-fossil certificates, renewable energy power menus, and renewable energy certificates.
-
*3In FY2024, greenhouse gas emissions increased as a result of a review of the data subject to calculation and changes to the calculation methodology.
-
*4Regarding third-party assurance of Water intake/Wastewater data, data was obtained from 14 major sites from FY2020 to FY2022. From FY2023 onward, the scope was expanded, with data obtained from 21 global sites in FY2023 and from all global sites in FY2024.
-
*5We have reviewed the breakdown of water withdrawals and classified desalinated water, industrial water, and reclaimed water into the "Others" category.
Involvement with Society
*You can scroll left and right
| Involvement with Society | Scope of data*1 | Unit | Period | FY2021 | FY2022 | FY2023 | FY2024 | FY2025 |
|---|---|---|---|---|---|---|---|---|
| Diethylcarbamazine (DEC) tablets supplied (billion tablets) | Global | Billion tablets | Annually | 0.4 | 0.8 | 1.5 | 2.4 | 3.2 |
| Cumulative quantity of DEC tablets supplied (billion tablets) | Global | Billion tablets | 20.5 | 21.3 | 22.8 | 25.2 | 28.4 | |
| Amount of funds donated (millions of yen) | Global | Millions of yen | Annually | 2,738 | 2,912 | 2,929 | 2,882 | 2,566 |
Involvement with Employees
*You can scroll left and right
| Involvement with Employees | Scope of data*1 | Unit | Period | FY2021 | FY2022 | FY2023 | FY2024 | FY2025 | |
|---|---|---|---|---|---|---|---|---|---|
| Eisai group number of employees by region | Total | Global | Persons | At fiscal year end | 11,322 | 11,076 | 11,067 | 10,917 | 10,543 |
| Japan | Global | Persons | ☑4,591 | ☑4,490 | ☑4,314 | ☑4,330 | ☑4,432 | ||
| Americas (North America) | Global | Persons | ☑1,982 | ☑1,755 | ☑1,915 | ☑1,866 | ☑1,669 | ||
| EMEA (Europe, Middle East, Africa, Russia and Oceania) | Global | Persons | ☑1,200 | ☑1,234 | ☑1,305 | ☑1,351 | ☑1,159 | ||
| China | Global | Persons | ☑2,044 | ☑2,002 | ☑1,950 | ☑1,862 | ☑1,827 | ||
| East Asia Global South | Global | Persons | ☑1,505 | ☑1,595 | ☑1,583 | ☑1,508 | ☑1,456 | ||
| Eisai group ratio of women (in management) | Ratio of women | Global | % | At fiscal year end | ☑41% | ☑42% | ☑43% | ☑43% | ☑39% |
| Ratio of women in management | Global | % | ☑33% | ☑35% | ☑36% | ☑37% | ☑33% | ||
| Ratio of women in junior management*2 | Global | % | - | 33% | 37% | 32% | 28% | ||
| Ratio of women in management in revenue-generating functions*3 | Global | % | - | 34% | 35% | 39% | 32% | ||
| Ratio of women in STEM-related positions*4 | Global | % | - | 38% | 38% | 38% | 36% | ||
| Number of employees of Eisai Co., Ltd.*5 | Total | Eisai Co., Ltd. | Persons | At fiscal year end | 3,200 | 3,171 | 3,101 | 3,103 | 3,094 |
| Male | Eisai Co., Ltd. | Persons | ☑2,367 | 2,326 | 2,263 | 2,244 | 2,214 | ||
| Female | Eisai Co., Ltd. | Persons | ☑833 | 845 | 838 | 859 | 880 | ||
| Eisai Co., Ltd. | % | 26.0% | 26.6% | 27.0% | 27.7% | 28.4% | |||
| Number of temporary employees | Eisai Co., Ltd. | Persons | At fiscal year end | 263 | 243 | 279 | 317 | 294 | |
| Ratio of temporary employees to total employees*5 | Eisai Co., Ltd. | % | At fiscal year end | 7.6% | 7.1% | 8.3% | 9.3% | 8.7% | |
| Number of managers*6 | Total | Eisai Co., Ltd. | Persons | At fiscal year end | 1,187 | 1,216 | 1,235 | 1,252 | 1,226 |
| Female | Eisai Co., Ltd. | Persons | 137 | 145 | 158 | 170 | 175 | ||
| Ratio of women in management*6 | Total | Eisai Co., Ltd. | % | At fiscal year end | 11.5% | 11.9% | 12.8% | 13.6% | 14.3% |
| Newly appointed managers | Eisai Co., Ltd. | % | 28.1% 18/64 |
21.6% 11/51 |
25.4% 13/51 |
30.4% 14/46 |
26.1% 12/46 |
||
| Average age*5 | Eisai Co., Ltd. | Years old | At fiscal year end | 43.4 | 43.9 | 44.4 | 44.8 | 44.8 | |
| Average years of employment*5 | Total | Eisai Co., Ltd. | Year | At fiscal year end | 17.8 | 17.9 | 18.7 | 18.8 | 18.7 |
| Male | Eisai Co., Ltd. | Year | 19.6 | 20.0 | 20.5 | 20.5 | 20.6 | ||
| Female | Eisai Co., Ltd. | Year | 12.6 | 13.2 | 13.9 | 14.2 | 14.1 | ||
| Turnover rate (resignation) | Eisai Co., Ltd.*5,7 | % | Annually | 3.1% | 3.4% | 3.4% | 3.7% | 3.5% | |
| Global*7 | % | Annually | 11.0% | 9% | 7% | 7% | 8% | ||
| Total turnover rate | Eisai Co., Ltd.*5,8 | % | Annually | 4.0% | 4.4% | 4.4% | 5.3% | 4.8% | |
| Global*8 | % | Annually | 15.0% | 14.0% | 10.0% | 10.0% | 12% | ||
| Penetration of corporate concept hhc*9 | Global | % | Annually | 96% | 96% | 96% | 95% | 95% | |
| Global Engagement Survey Score: Sustainable Engagement (response rate) |
Global | % | Annually | 85% (81%) |
85% (83%) |
☑85% (90%) |
☑85% (94%) |
☑85% (94%) |
|
| Number of users of childcare leave program*5,10 | Total | Eisai Co., Ltd. | Persons | Annually | 133 | 130 | 137 | 126 | 161 |
| Male | Eisai Co., Ltd. | Persons | 40 | 38 | 50 | 46 | 68 | ||
| Female | Eisai Co., Ltd. | Persons | 93 | 92 | 87 | 80 | 93 | ||
| Number of users of spousal maternity leave program*5,11 | Eisai Co., Ltd. | Persons | Annually | 59 | 57 | 69 | 63 | 67 | |
| Number of users of short working hours program for childcare*5 | Eisai Co., Ltd. | Persons | Annually | 50 | 54 | 52 | 49 | 49 | |
| Average annual salary (according to the annual securities report) |
Eisai Co., Ltd. | Thousands of yen | Annually | 9,202 | 10,503 | 10,539 | 10,556 | 11,234 | |
|
Gender pay gap*12 (Mean) |
Eisai Co., Ltd. | % | Annually | - | ☑71.6% | ☑74.4% | ☑74.4% | ☑75.7% | |
| Personal development expenses (per employee)*5,13 |
Eisai Co., Ltd. | Thousands of yen | Annually | 188 | 169 | 176 | 169 | 169 | |
| Percentage of employees with disabilities | Eisai Co., Ltd. | % | Annually | ☑2.33% | ☑2.45% | ☑2.51% | ☑2.54% | ☑2.56% | |
| Share of annual female hires (Female/Total)*5 |
Eisai Co., Ltd. | % | Annually | 45.1% 116/257 |
32.4% 36/111 |
37.3% 28/75 |
31.4% 33/105 |
45.8% 65/142 |
|
| Number of new employee hires | Global | Persons | Annually | - | 1,340 | 1,194 | 989 | 949 | |
| Number of hired new graduates*5,14 | Total | Eisai Co., Ltd. | Persons | Annually | 197 | 66 | 51 | 63 | 113 |
| Male | Eisai Co., Ltd. | Persons | 93 | 37 | 30 | 39 | 52 | ||
| Female | Eisai Co., Ltd. | Persons | 104 | 29 | 21 | 24 | 61 | ||
| Retention rate of hired new graduates after 3 years*5,14,15 | Total (5 years average 91.1%) |
Eisai Co., Ltd. | % | At fiscal year end | 93.8% 91/97 |
90.8% 118/130 |
91.4% 180/197 |
95.5% 63/66 |
92.2% 47/51 |
| Male (5 years average 91.4%) |
Eisai Co., Ltd. | % | 92.0% 46/50 |
88.1% 59/67 |
92.5% 86/93 |
97.3% 36/37 |
96.7% 29/30 |
||
| Female (5 years average 90.7%) |
Eisai Co., Ltd. | % | 95.7% 45/47 |
93.7% 59/63 |
90.4% 94/104 |
93.1% 27/29 |
85.7% 18/21 |
||
| Retention rate of hired new graduates after 5 years*5,14,15 | Total (5 years average 79.3%) |
Eisai Co., Ltd. | % | At fiscal year end | 81.4% 35/43 |
76.3% 45/59 |
79.4% 77/97 |
83.1% 108/130 |
82.7% 163/197 |
| Male (5 years average 80.2%) |
Eisai Co., Ltd. | % | 78.3% 18/23 |
81.3% 26/32 |
80.0% 40/50 |
83.6% 56/57 |
81.7% 76/93 |
||
| Female (5 years average 78.4%) |
Eisai Co., Ltd. | % | 85.0% 17/20 |
70.4% 19/27 |
78.7% 37/47 |
82.5% 52/63 |
83.7% 87/104 |
||
| Retention rate of hired new graduates after 10 years*5,14,15 | Total (5 years average 64.8%) |
Eisai Co., Ltd. | % | At fiscal year end | 66.7% 14/21 |
57.9% 44/76 |
66.7% 2/3 |
69% 69/100 |
64.1% 25/39 |
| Male (5 years average 69.1%) |
Eisai Co., Ltd. | % | 66.7% 8/12 |
60.9% 28/46 |
50.0% 1/2 |
71.2% 47/66 |
65.0% 13/20 |
||
| Female (5 years average 57.1%) |
Eisai Co., Ltd. | % | 66.7% 6/9 |
53.3% 16/30 |
100.0% 1/1 |
64.7% 22/34 |
63.2% 12/19 |
||
| Average monthly overtime hours (per non-management employee) |
Eisai Co., Ltd. | Hours | Annually | 13h59m | 14h19m | 7h40m | 7h20m | 6h34m | |
| Number of work-related accidents (lost time injuries, non-lost time injuries, traffic accidents)*16 |
Eisai Co., Ltd. | Incidents | Annually | 21 | 11 | 8 | 12 | TBC | |
| Global | Incidents | Annually | ☑66 | ☑53 | ☑62 | ☑65 | TBC | ||
| Lost Time Injury Frequency Rate (LTIFR), more than 4 days*16,17 | Employee |
Eisai Co., Ltd. | Incidents | Annually | 0.31 | 0 | 0 | 0 | TBC |
| Lost Time Injury Frequency Rate (LTIFR), more than 1 day*16,18 | Employee | Global | Incidents | Annually | ☑0.52 | ☑0.63 | ☑0.65 | ☑0.56 | TBC |
| Number of work-related fatalities*16 |
Employee | Eisai Co., Ltd. | Incidents | Annually | 0 | 0 | 0 | 0 | TBC |
| Employee |
Global | Incidents | Annually | 0 | 0 | 0 | ☑0 | TBC | |
| Percentage of employees who underwent health checks | Employee | Eisai Co., Ltd. | % | Annually | 98.74% | 99.93% | 100.0% | 100.0% | 100.0% |
| Family members*19 | Eisai Co., Ltd. | % | 89.35% | 71.05% | 75.22% | 76.93% | 73.48% | ||
| Average days of paid holidays taken (per non-management employee) |
Eisai Co., Ltd. | Day | Annually | 11.2 | 13.3 | 12.8 | 13.0 | 13.7 | |
-
*1Global: Eisai Co., Ltd. and domestic and overseas group companies. Eisai Co., Ltd., domestic group: Eisai Co., Ltd. and domestic group companies.
-
*2We count lower level of management position within a company’s management hierarchy.
-
*3We count management position in sales and marketing functions excluding support functions such as HR, Legal and IT.
-
*4We count STEM (Science, Technology, Engineering, or Mathematics) related employees.
-
*5Based on the number of fulltime Eisai Co., Ltd. employees including employees dispatched to Eisai Network Companies (ENW)
-
*6Based on the number of employees disclosed in the Annual Securities Report (Eisai Co., Ltd. employees include those dispatched from ENW and exclude those dispatched to ENW)
-
*7Voluntary termination only, not including mandatory retirement due to age, voluntary retirement, etc.
-
*8Covering all forms of leaving the Company, such as voluntary termination, mandatory retirement due to age, voluntary retirement, etc.
-
*9Response rate of Favorable or higher for the question "Support for corporate concept" in Eisai Global Engagement Survey.
-
*10Childcare leave program Entitlement: Workers requested childcare leave for child/children under the age of 3; Period: Until the day specified by the employee, provided that this is before the child’s 3rd birthday
-
*11Spousal maternity leave program Entitlement: Workers whose partner has given birth Period: Up to 5 days of special paid holiday
-
*12The gender pay gap shows the ratio of women's wages to men's wages. There is no difference in wages for the same work, and this is due to the difference in the composition of the number of workers by grade.
-
*13Personal development expenses include training, studying abroad, and participation in academic conferences
-
*14Not including employees who joined the company midway through the year
-
*15At the beginning of next fiscal year (e.g. The number of retention rate after 3 years for fiscal 2023 indicates the rate of retention of the new graduates hired in fiscal 2021 as of April 1, 2024)
-
*16These figures cover employees, part-time workers, and temporary workers.
-
*17Eisai Co., Ltd. Lost Time Injury Frequency Rate = Number of casualties resulting from occupational and traffic accidents (absence of 4 days or more) ÷ Total working hours × 1,000,000
-
*18Eisai Group Lost Time Injury Frequency Rate = Number of casualties resulting from occupational and traffic accidents (absence of 1 day or more) ÷ Total working hours × 1,000,000
According to the 2023 Survey of Occupational Accident Trends conducted by the Ministry of Health, Labour and Welfare, the Lost Time Injury Frequency Rate for the Pharmaceutical manufacturing industry was 1.01. -
*19Health check eligibility includes dependent spouses and dependent family members aged 40 or older.
Sustainability Data Calculation Report
Eisai Co., Ltd.
| Calculation period: April 1, 2025 to March 31, 2026 (If the calculation period is different, details are indicated in the table below) | ||||
|---|---|---|---|---|
| Calculation target | Scope of calculation | Calculation method/definition of calculation target | Number | * |
|
Greenhouse gas emissions: Scope 1 (CO2 from energy sources) |
Eisai Co., Ltd. and domestic and overseas group companies (hereafter referred to as "Global") |
|
38,980 t-CO2 | ☑ |
|
Greenhouse gas emissions: Scope 2 |
Global |
・CO2 emissions are calculated on a market-based method. ・The following electricity emission factors are used: Japan: Emission factors by electricity supplier (adjusted emission factors (residual) for calculating greenhouse gas emissions from specific emitters) Overseas: IEA database (IEA Emission Factors 2025 edition) ・The emission coefficients for CO2 emissions from heat (hot water) and cooling (cold water) sources are based on the “List of calculation methods and emission coefficients in the calculation, reporting, and disclosure system.” , Ministry of the Environment, Government of Japan. ・For facilities (offices) where original electricity consumption data, such as utility invoices issued by electricity suppliers, cannot be readily obtained, the following estimation methods are used: 1. Allocate the facility's electricity consumption based on the usage of the entire building; or 2. Estimate the facility's electricity consumption based on the usage of similar facilities. ・For electricity, non-fossil certificates, renewable energy power programs, and renewable energy certificates are used. |
4,927 t-CO2 | ☑ |
|
Greenhouse gas emissions: Scope 3 (Category 1) |
Global Purchased raw materials, consignments, and supplies |
|
759,554 t-CO2 | ☑ |
| Water Withdrawal |
Global |
・Meter readings or invoice data for tap water, surface water, groundwater, and purchased recycled water are used. ・For research/production/office facilities where it is difficult to obtain original data on raw water withdrawal, the following estimation methods are used: 1. Allocate the facility's water withdrawal based on the usage of the entire building; or |
3,146 thousand m3 | ☑ |
| Water discharge |
Global |
|
2,321 thousand m3 | ☑ |
| Amount of waste generated |
Global Total of 29 locations |
|
5,484 ton | ☑ |
| Number of employees by region |
Global |
|
Total: Japan 4,432 Americas 1,669 employees EMEA 1,159 employees China EAGS 1,456 employees |
☑ |
| Ratio of women | Global (excluding the Americas Region) |
・The ratio is calculated by dividing the number of female employees in consolidated companies excluding the Americas Region by the total number of employees in consolidated companies excluding the Americas Region. ・Compiled based on data on the number of male and female employees reported by consolidated companies excluding the Americas Region. ・The definition of employees is the same as that used for the number of employees by region. ・The scope of aggregation is determined based on the laws and regulations in each country and region. ・From FY2025, the scope of aggregation has been changed from all consolidated companies to consolidated companies excluding those in the Americas Region. Figures for prior fiscal years have been revised using the same aggregation method. |
39% | ☑ |
| Ratio of women in management |
Global |
・The ratio is calculated by dividing the number of female managers in consolidated companies excluding the Americas Region divided by the total number of managers in consolidated companies excluding the Americas Region. ・The definition of a managerial position depends on the personnel system of each country. ・The definition of employees is the same as that used for the number of employees by region. ・The scope of aggregation is determined based on the laws and regulations in each country and region. ・From FY2025, the scope of aggregation has been changed from all consolidated companies to consolidated companies excluding those in the Americas Region. Figures for prior fiscal years have been revised using the same aggregation method. |
33% | ☑ |
| Gender pay gap |
Eisai Co., Ltd. |
・The percentage represents the average salary of female employees relative to that of male employees, with the average salary of male employees in fiscal year 2025 set at 100. ・”Salary” refers to the total cash earnings as defined in the Monthly Labour Survey conducted by the Ministry of Health, Labour and Welfare. ・The definition of employees is the same as that used for the number of employees by region. |
75.7% | ☑ |
| Percentage of employees with disabilities | Eisai Co., Ltd. |
|
2.56% | ☑ |
| Global Engagement Survey Score: Sustainable Engagement | Global |
・The Willis Towers Watson (WTW) system is used to conduct an annual awareness survey and calculate scores. ・This figure is calculated by averaging the percentages of employees who responded favorably to each of the seven questions related to "sustainable engagement". ・The scope of the survey covers regular employees of all consolidated companies. The EMEA Region was not included in the FY2025 survey due to the implementation of structural reforms. ・The latest survey was conducted over a two-week period from January 26 to February 6, 2026, targeting regular employees as of October 1, 2025. |
85 points | ☑ |
*Figures marked with ☑ have received independent assurance.
The original text of the calculation reports on independent assurance is written in Japanese. Please see the Japanese version for details.