Environmental Protection Initiatives and Results
Fiscal 2024 Environmental Protection Initiatives and Results of the Eisai Group
*You can scroll to the left or right here
| Category | Fiscal 2024 Initiatives (Targets) | Boundary | Fiscal 2024 Results |
|---|---|---|---|
| Enhancement of environmental management |
|
Global |
|
|
Japan |
|
|
| Energy conservation and preventing global warming |
|
Global |
|
|
Eisai Co., Ltd. |
|
|
|
Global |
|
|
|
Japan |
|
|
| Waste reduction |
|
Global |
|
|
Japan |
|
|
| Effective use of water resources |
|
Global |
|
| Management of chemical substances and preventing from pollution |
|
Japan |
|
| Biodiversity protection |
|
Global |
|
| Resource conservation |
|
Eisai Co., Ltd. |
|
| Conservation of the local environment |
|
Japan |
|
Resource Input and Environmental Impact
Fiscal 2024 Resource Input and Environmental Impact Data of the Eisai Group in Japan
*You can scroll to the left or right here
| Resource Input | ||||
|---|---|---|---|---|
| Input | Unit | Eisai Co., Ltd. | Group companies in Japan |
Total |
| Energy | ||||
| Electric power | MWh | 96,455 | 12,376 | 108,831 |
| LPG | tons | 7 | 9 | 17 |
| LNG | tons | 0 | 1,283 | 1,283 |
| Processed natural gas | 1,000N㎥ | 7,866 | 179 | 8,045 |
| Kerosene | kl | 0 | 0 | 0 |
| Diesel oil | kl | 4 | 1 | 5 |
| Gasoline | kl | 764 | 302 | 1,066 |
| Fuel oil A | kl | 29 | 0 | 29 |
| Industrial steam | GJ | 59,572 | 0 | 59,572 |
| Hot water | GJ | 83 | 0 | 83 |
| Cold water | GJ | 176 | 0 | 176 |
| Water | ||||
| Water consumption | 1,000㎥ | 2,653 | 90 | 2,743 |
| Clean water | 1,000㎥ | 127 | 90 | 217 |
| Industrial water | 1,000㎥ | 2 | 0 | 2 |
| Groundwater | 1,000㎥ | 2,511 | 0 | 2,511 |
| Recycled water | 1,000㎥ | 10 | 0 | 10 |
| Desalinated water | 1,000㎥ | 71 | 0 | 71 |
| Reclaimed water | 1,000㎥ | 2 | 0 | 2 |
| PRTR Substances | ||||
| Total amount handled | tons | 391 | 43 | 434 |
| Others | ||||
| Copy paper consumption | 10,000sheets | 1,058 | 734 | 1,792 |
*You can scroll to the left or right here
| Environmental Impact | ||||
|---|---|---|---|---|
| Output | Unit | Eisai Co., Ltd. | Group companies in Japan |
Total |
| Waste | ||||
| Amount generated (tons) | tons | 3,849 | 618 | 4,466 |
| Amount recycled | tons | 554 | 161 | 715 |
| Amount sent to landfill | tons | 5 | 7 | 12 |
| Wastewater discharge | 1,000㎥ | 2,166 | 50 | 2,216 |
| BOD | kg | 4,616 | 46 | 4,663 |
| Nitrogen | kg | 2,641 | 34 | 2,675 |
| Phosphorous | kg | 60 | 34 | 94 |
| PRTR substances (off-sie transfer as waste) | tons | 291 | 42 | 334 |
| PRTR substances (release into water bodies) | tons | 0 | 0 | 0 |
| Containers and Packaging Recycling | ||||
| Recycling of containers and packaging materials (obligatory recycling amount) | 1,901 | 96 | 1,996 | |
| Atmospheric Emissions (from operational sites) | ||||
| CO2 (Scope 1, 2) | tons | 20,289 | 4,876 | 25,166 |
| SOx | tons | 0 | 0 | 0 |
| NOx | tons | 12 | 0 | 12 |
| Soot and dust | tons | 0 | 0 | 0 |
| PRTR substances | tons | 21 | 1 | 22 |
| Exhaust Gas from Vehicles | ||||
| CO2 emissions from commercial vehicles | tons | 1,736 | 667 | 2,404 |
| CO2 emissions from business-use vehicles other than commercial vehicles | tons | 7 | 23 | 30 |
Environmental Accounting
The environmental protection costs of our group companies in Japan, calculated with reference to the "Environmental Accounting Guidelines 2005" issued by the Ministry of the Environment, are as follows:
FY2024 Environmental Protection Costs
*You can scroll to the left or right here
| Main Category | Contents | Investment (million yen) | Cost (million yen) | Economic Effects (million yen) | Quantitative Effects (million yen) | Comments |
|---|---|---|---|---|---|---|
| Cost in the business area | Environmental protection costs to reduce the environmental impact caused within the business area by main business activities | 32 | 356 | 13 | - | - |
| Upstream/downstream cost | Environmental protection costs to reduce the environmental impact caused upstream or downstream by major business activities | 3 | 2,928 | 0 | - | - |
| (green purchasing) | The cost of purchasing products and goods with low environmental impact | 0 | 700 | 0 | - | - |
| Managerial activity cost | Costs of managing environmental conservation | 1 | 232 | 0 | - | - |
| Cost of research and development | Research and development costs for products that contribute to environmental conservation | 0 | 0 | 0 | - | - |
| Social activity cost | Environmental protection costs in social activities | 0 | 0 | 0 | - | - |
| Cost corresponding to the environment damage | Costs for restoration of soil contamination and the natural environment, etc. | 0 | 1 | 0 | - | - |
| Total | 36 | 3,518 | 13 | - | - |
Breakdown of Energy Consumption
Breakdown of Energy Consumption (FY2024)
*You can scroll to the left or right here
| Electric power (MWh) | Gasoline (kl) | Kerosene (kl) | Light oil (kl) | Fuel oil A (kl) | LPG (tons) | Natural gas (1000㎥) | Biogas (MWh) | LNG (tons) | Processed natural gas (1,000㎥) | Industrial steam (GJ) | Hot water and cold water (GJ) | ||
|---|---|---|---|---|---|---|---|---|---|---|---|---|---|
| In Japan | Amount used | 108,831 | 1,066 | 0 | 5 | 29 | 17 | 0 | 0 | 1,283 | 8,045 | 59,572 | 259 |
| Calorific value (GJ) | 1,012,589 | 35,577 | 0 | 187 | 1,127 | 836 | 0 | - | 70,157 | 319,811 | 81,017 | 352 | |
| Ratio (%) | 66.5 | 2.3 | 0.0 | 0.0 | 0.1 | 0.1 | 0.0 | 0.0 | 4.6 | 21.0 | 5.3 | 0.0 | |
| Outside Japan | Amount used | 69,176 | 3,637 | 0 | 970 | 158 | 48 | 5,988 | 2,631 | 0 | 0 | 10,750 | 1 |
| Calorific value (GJ) | 643,631 | 121,362 | 0 | 36,726 | 6,125 | 2,391 | 229,722 | 5,012 | 0 | 0 | 14,620 | 1 | |
| Ratio (%) | 61 | 11 | 0 | 3 | 1 | 0 | 22 | 0 | 0 | 0 | 1 | 0 | |
| Total | Amount used | 178,007 | 4,704 | 0 | 975 | 187 | 64 | 5,988 | 2,631 | 1,283 | 8,045 | 70,321 | 260 |
| Calorific value (GJ) | 1,656,220 | 156,939 | 0 | 36,913 | 7,252 | 3,227 | 229,722 | 5,012 | 70,157 | 319,811 | 95,637 | 353 | |
| Ratio (%) | 64 | 6 | 0 | 1 | 0 | 0 | 9 | 0 | 3 | 12 | 4 | 0 |
Resource Input and Environmental Impact (Eisai Group in Japan)
Kawashima Industrial Park (FY)
*You can scroll to the left or right here
| 2022 | 2023 | 2024 | |
|---|---|---|---|
| GHG emissions | |||
| CO2 emissions (Scope1+2) (tons) | 10,873 | 10,783 | 10,936 |
| Energy consumption | |||
| Purchased electricity (MWh) | 41,101 | 42,439 | 43,568 |
| Town gas (1,000N㎥) | 5,328 | 5,280 | 5,381 |
| Liquefied petroleum gas (LPG) (tons) | 1 | 1 | 1 |
| Waste treatment | |||
| Amount of waste generated (tons) | 1,260 | 1,613 | 1,507 |
| Recycled amount (tons) | 154 | 141 | 203 |
| Amount sent to landfill (tons) | 0 | 0 | 0 |
| Air pollutant emissions | |||
| SOx (kg)*1 | - | - | - |
| NOx (kg) | 8,550 | 11,556 | 9,847 |
| Soot and dust (kg)*1 | - | - | - |
| Environmental impact in wastewater | |||
| Water intake (1,000㎥)*2 | 3,027 | 2,622 | 2,391 |
| Wastewater discharge (1,000㎥)*2 | 1,933 | 2,060 | 1,909 |
| BOD (kg) | 2,822 | 2,068 | 2,180 |
| Nitrogen (kg) | 2,467 | 2,571 | 2,641 |
| Phosphorus (kg) | 62 | 61 | 60 |
*1 SOx emissions from the Kawashima plant were all below detection limit. Soot & Dust emissions from the Kawashima plant were also below detection limit.
“-”: Below detection Limit
*2 At the Kawashima plant, groundwater was pumped up and discharged as the source of regional rivers based on a request from the local government and the relevant figures are listed. The actual amount of water used in the manufacturing process and the amount of wastewater were both 200,276㎥ (as of FY2024)
Tsukuba Research Laboratories (FY)
*You can scroll to the left or right here
| 2022 | 2023 | 2024 | |
|---|---|---|---|
| GHG emissions | |||
| CO2 emissions (Scope1+2) (tons) | 4,467 | 4,178 | 4,093 |
| Energy consumption | |||
| Purchased electricity (MWh) | 25,136 | 26,258 | 26,998 |
| Town gas (1,000N㎥) | 2,166 | 2,046 | 1,977 |
| Heavy oil A (kl) | 16 | 0 | 28 |
| Waste treatment | |||
| Amount of waste generated (tons) | 256 | 173 | 246 |
| Recycled amount (tons) | 102 | 64 | 65 |
| Amount sent to landfill (tons) | 1 | 1 | 1 |
| Air pollutant emissions | |||
| SOx (kg)*1 | - | - | - |
| NOx (kg) | 2,685 | 1,875 | 1,797 |
| Soot and dust (kg)*1 | - | - | - |
| Environmental impact in wastewater | |||
| Water intake (1,000㎥) | 213 | 188 | 167 |
| Recycled water (1,000㎥) | 80 | 71 | 71 |
| Wastewater discharge (1,000㎥) | 213 | 186 | 167 |
| BOD (kg) | 3,172 | 3,883 | 2,152 |
*1 SOx emissions from the Tsukuba research laboratories were all below detection limit. Soot & Dust emissions from the Tsukuba research laboratories were also below detection limit.
“-”: Below detection Limit
Kashima Plant (FY)
*You can scroll to the left or right here
| 2022 | 2023 | 2024 | |
|---|---|---|---|
| GHG emissions | |||
| CO2 emissions (Scope1+2) (tons) | 3,236 | 2,597 | 2,479 |
| Energy consumption | |||
| Purchased electricity (MWh) | 16,937 | 18,164 | 19,068 |
| Industrial steam (GJ) | 56,658 | 58,526 | 59,572 |
| Liquefied petroleum gas (LPG) (tons) | 6 | 6 | 6 |
| Waste treatment | |||
| Amount of waste generated (tons) | 1,691 | 1,524 | 1,783 |
| Recycled amount (tons) | 364 | 224 | 126 |
| Amount sent to landfill (tons) | 0 | 0 | 0 |
| Environmental impact in wastewater | |||
| Water intake (1,000㎥) | 57 | 57 | 54 |
| Wastewater discharge (1,000㎥) | 51 | 52 | 52 |
| BOD (kg) | 765 | 294 | 249 |
EA Pharma Co., Ltd., Fukushima Plant (FY)
*You can scroll to the left or right here
| 2022 | 2023 | 2024 | |
|---|---|---|---|
| GHG emissions | |||
| CO2 emissions (Scope1+2) (tons) | 6,670 | 3,827 | 3,594 |
| Energy consumption | |||
| Purchased electricity (MWh) | 8,935 | 9,843 | 9,721 |
| Liquefied petroleum gas (LPG) (tons) | 9 | 9 | 9 |
| Liquefied natural gas (LNG) (tons) | 1,494 | 1,364 | 1,283 |
| Waste treatment | |||
| Amount of waste generated (tons) | 479 | 545 | 550 |
| Recycled amount (tons) | 147 | 188 | 131 |
| Amount sent to landfill (tons) | 3 | 3 | 2 |
| Air pollutant emissions | |||
| SOx (kg)*1 | - | - | - |
| NOx (kg) | 438 | 337 | 340 |
| Soot and dust (kg) | 15 | 31 | 23 |
| Environmental impact in wastewater | |||
| Water intake (1,000㎥) | 71 | 68 | 72 |
| Wastewater discharge (1,000㎥) | 36 | 32 | 35 |
| BOD (kg) | 34 | 56 | 46 |
| Nitrogen (kg) | 84 | 44 | 34 |
| Phosphorus (kg) | 51 | 32 | 34 |
*1 SOx emissions from the EA Pharma Fukushima plant were all below detection limit.
“-”: Below detection Limit
Kobe Research Institute (former KAN Research Institute Co., Ltd.) (FY)
*You can scroll to the left or right here
| 2022 | 2023 | 2024 | |
|---|---|---|---|
| GHG emissions | |||
| CO2 emissions (Scope1+2) (tons) | 1,759 | 754 | 925 |
| Energy consumption | |||
| Purchased electricity (MWh) | 3,281 | 3,345 | 3,255 |
| Town gas (1,000N㎥) | 370 | 370 | 456 |
| Waste treatment | |||
| Amount of waste generated (tons) | 53 | 51 | 49 |
| Recycled amount (tons) | 23 | 18 | 14 |
| Amount sent to landfill (tons) | 1 | 1 | 1 |
| Environmental impact in wastewater | |||
| Water intake (1,000㎥) | 12 | 15 | 17 |
| Wastewater discharge (1,000㎥) | 11 | 12 | 14 |
| BOD (kg) | 32 | 176 | 35 |
Principal PRTR Substances Handled (FY)
*You can scroll to the left or right here
| 2022 | 2023 | 2024 | |
|---|---|---|---|
| Tsukuba Research Laboratories | |||
| Dichloromethane (tons) | 0.5 | 0.5 | 0.7 |
| Hexane (tons) | 0.1 | 0.1 | 0.1 |
| N,N-Dimethylformamide(tons) | 0.3 | 0.5 | 1.3 |
| Heptane(tons)* | 2.0 | 2.0 | 2.0 |
| Kashima Plant | |||
| Ethylbenzene (tons) | 5.1 | 8.2 | 7.8 |
| Triethylamine (tons) | 1.6 | 1.9 | 4.0 |
| Dichloromethane (tons) | 131.8 | 78.9 | 155.8 |
| N,N-dimethylformamide (tons) | 32.7 | 24.0 | 16.3 |
| Toluene (tons) | 42.4 | 45.6 | 62.3 |
| Paraformaldehyde (tons) | 1.5 | 0.0 | 2.1 |
| Hexane (tons) | 11.1 | 7.2 | 19.3 |
| 1,2-Dimethoxyethane(tons)* | - | 2.2 | 3.3 |
| Tetrahydrofuran(tons)* | 38.1 | 40.7 | 23.9 |
| Heptane(tons)* | 73.9 | 102.9 | 76.9 |
| N-Methyl-2-pyrrolidone(tons)* | - | 8.2 | 16.5 |
| EA Pharma Co., Ltd., Fukushima Plant | |||
| Dichloromethane (tons) | 35.0 | 52.8 | 42.8 |
*1,2-Dimethoxyethane, tetrahydrofuran, heptane and N-methyl-2-pyrrolidone became PRTR-listed substances in FY2023.
Principal VOC Substances Handled (FY)
*You can scroll to the left or right here
| 2022 | 2023 | 2024 | |
|---|---|---|---|
| Kawashima Industrial Park | |||
| Acetonitrile (tons)* | 1.3 | 1.7 | 1.4 |
| Methanol (tons) | 1.2 | 0.9 | 1.0 |
| Ethanol (tons) | 16.0 | 10.3 | 8.6 |
| Tsukuba Research Laboratories | |||
| Acetonitrile (tons)* | 3.6 | 0.0 | 4.4 |
| Ethyl acetate (tons) | 3.0 | 3.0 | 3.0 |
| Methanol (tons) | 4.9 | 4.9 | 5.1 |
| Ethanol (tons) | 2.0 | 2.0 | 2.2 |
| Kashima Plant | |||
| Acetonitrile (tons)* | 56.7 | 0.0 | 109.2 |
| Ethyl acetate (tons) | 190.7 | 197.1 | 268.3 |
| Methanol (tons) | 399.4 | 453.4 | 504.2 |
| Methyl ethyl ketone (tons) | 3.5 | 3.5 | 3.6 |
| Isopropanol (tons) | 15.1 | 11.4 | 13.6 |
| Acetone (tons) | 289.7 | 229.8 | 292.5 |
| Ethanol (tons) | 46.2 | 46.1 | 42.6 |
| Propanol (tons) | 3.5 | 1.9 | 1.7 |
| EA Pharma Co., Ltd., Fukushima Plant | |||
| Acetonitrile (tons)* | 1.1 | 1.1 | 0.9 |
| Methanol (tons) | 20.6 | 25.5 | 21.1 |
| Isopropanol (tons) | 4.0 | 4.0 | 5.3 |
Acetonitrile is exempted from PRTR substances from FY2023.
Resource Input and Environmental Impact (Group Companies Outside Japan)
Eisai China Inc., Suzhou Plant (Jiangsu, China) (FY)
*You can scroll to the left or right here
| 2022 | 2023 | 2024 | |
|---|---|---|---|
| GHG emissions | |||
| CO2 emissions (Scope1+2) (tons) | 3,109 | 3,088 | 3,025 |
| Energy consumption | |||
| Purchased electricity (MWh) | 17,414 | 18,109 | 18,480 |
| Industrial steam (GJ) | - | - | 10,750 |
| Natural gas (1,000㎥) | 1,554 | 1,459 | 1,147 |
| Diesel oil (kl) | 51 | 62 | 61 |
| Waste treatment | |||
| Amount of waste generated (tons) | 103 | 100 | 120 |
| Recycled amount (tons) | 0 | 0 | 0 |
| Amount sent to landfill (tons) | - | - | 0 |
| Air pollutant emissions | |||
| SOx (kg) | 0 | 168 | 0 |
| NOx (kg) | 292 | 823 | 1,321 |
| Soot and dust (kg) | 148 | 21 | 72 |
| Environmental impact in wastewater | |||
| Water intake (1,000㎥) | 155 | 152 | 146 |
| Wastewater discharge (1,000㎥) | 124 | 64 | 66 |
| BOD (kg) | - | - | 2,630 |
| COD (kg) | - | - | 6,822 |
| Nitrogen (kg) | - | - | 874 |
| Phosphorus (kg) | 113 | 62 | 88 |
Eisai (Liaoning) Pharmaceutical Co., Ltd., Benxi Plant (Liaoning, China) (FY)
*You can scroll to the left or right here
| 2022 | 2023 | 2024 | |
|---|---|---|---|
| GHG emissions | |||
| CO2 emissions (Scope1+2) (tons) | 1,842 | 2,046 | 1,728 |
| Energy consumption | |||
| Purchased electricity (MWh) | 4,629 | 4,841 | 4,195 |
| Natural gas (1,000㎥) | 920 | 973 | 834 |
| Diesel oil (kl) | 1 | 32 | 27 |
| Waste treatment | |||
| Amount of waste generated (tons) | 273 | 122 | 98 |
| Recycled amount (tons) | 0 | 0 | 0 |
| Amount sent to landfill (tons) | 48 | 50 | 50 |
| Air pollutant emissions | |||
| SOx (kg) | 83 | 117 | 75 |
| NOx (kg) | 1,816 | 1,738 | 1,058 |
| Soot and dust (kg) | 212 | 219 | 78 |
| Environmental impact in wastewater | |||
| Water intake (1,000㎥) | 53 | 58 | 43 |
| Wastewater discharge (1,000㎥) | 45 | 50 | 29 |
| BOD (kg) | 451 | 388 | 205 |
| COD (kg) | - | - | 471 |
| Nitrogen (kg) | 203 | 405 | 59 |
| Phosphorus (kg) | 21 | 22 | 18 |
PT Eisai Indonesia, Bogor Plant (West Java, Indonesia) (FY)
*You can scroll to the left or right here
| 2022 | 2023 | 2024 | |
|---|---|---|---|
| GHG emissions | |||
| CO2 emissions (Scope1+2) (tons) | 3 | 3 | 7 |
| Energy consumption | |||
| Purchased electricity (MWh) | 994 | 1,013 | 1,039 |
| Diesel oil (kl) | 1 | 1 | 2 |
| Waste treatment | |||
| Amount of waste generated (tons) | 4 | 6 | 11 |
| Recycled amount (tons) | 0 | 0 | 0 |
| Amount sent to landfill (tons) | 0 | 0 | 0 |
| Environmental impact in wastewater | |||
| Water intake (1,000㎥) | 5 | 4 | 3 |
| Wastewater discharge (1,000㎥) | 5 | 4 | 3 |
| BOD (kg) | 11 | 13 | 9 |
| COD (kg) | - | - | 29 |
| Nitrogen (kg) | 18 | 10 | 12 |
Vizag Site (Andhra Pradesh, India) (FY)
*You can scroll to the left or right here
| 2022 | 2023 | 2024 | |
|---|---|---|---|
| GHG emissions | |||
| CO2 emissions (Scope1+2) (tons) | 4,251 | 3,428 | 2,668 |
| Energy consumption | |||
| Purchased electricity (MWh) | 17,199 | 16,664 | 13,943 |
| Natural gas (1,000㎥) | - | - | 842 |
| Diesel oil (kl) | 1,612 | 1,298 | 377 |
| Liquefied petroleum gas (LPG) (tons) | 9 | 9 | 9 |
| Waste treatment | |||
| Amount of waste generated (tons) | 52 | 57 | 79 |
| Recycled amount (tons) | 0 | 0 | 0 |
| Amount sent to landfill (tons) | 1 | - | 0 |
| Air pollutant emissions | |||
| SOx (kg) | 4,453 | 3,803 | 3,726 |
| NOx (kg) | 10,691 | 10,395 | 10,914 |
| Soot and dust (kg) | 3,226 | 3,119 | 2,856 |
| Environmental impact in wastewater | |||
| Water intake (1,000㎥) | 120 | 121 | 111 |
| Wastewater discharge (1,000㎥) | 41 | 34 | 35 |
| BOD (kg) | 32,994 | 29,221 | 31,953 |
| COD (kg) | 85,929 | 73,305 | 63,210 |
| Nitrogen (kg) | 704 | 637 | 646 |
EMEA Knowledge Centre (Hertfordshire, U.K.) (FY)
*You can scroll to the left or right here
| 2022 | 2023 | 2024 | |
|---|---|---|---|
| GHG emissions | |||
| CO2 emissions (Scope1+2) (tons) | 1,922 | 1,878 | 1,375 |
| Energy consumption | |||
| Purchased electricity (MWh) | 8,025 | 7,956 | 7,537 |
| Natural gas (1,000㎥) | 961 | 939 | 678 |
| Biogas (MWh) | - | - | 2,631 |
| Liquefied petroleum gas (LPG) (kl) | 3 | 2 | 1 |
| Waste treatment | |||
| Amount of waste generated (tons) | 255 | 246 | 248 |
| Recycled amount (tons) | 255 | 246 | 248 |
| Amount sent to landfill (tons) | 0 | 0 | 0 |
| Environmental impact in wastewater | |||
| Water intake (1,000㎥) | 24 | 26 | 24 |
| Wastewater discharge (1,000㎥) | 24 | 25 | 23 |
Exton Site (United States) (FY)
*You can scroll to the left or right here
| 2022 | 2023 | 2024 | |
|---|---|---|---|
| GHG emissions | |||
| CO2 emissions (Scope1+2) (tons) | 3,736 | 5,794 | 3,213 |
| Energy consumption | |||
| Purchased electricity (MWh) | 9,460 | 8,890 | 9,281 |
| Natural gas (1,000㎥) | 1,947 | 3,027 | 1,584 |
| Diesel oil (kl) | 9 | 8 | 35 |
| Waste treatment | |||
| Amount of waste generated (tons) | 113 | 113 | 159 |
| Recycled amount (tons) | 32 | 32 | 70 |
| Amount sent to landfill (tons) | 68 | 68 | 80 |
| Air pollutant emissions | |||
| SOx (kg) | 3 | 0 | 27 |
| NOx (kg) | 157 | 146 | 981 |
| Soot and dust (kg) | 6 | 9 | 13 |
| Environmental impact in wastewater | |||
| Water intake (1,000㎥) | 26 | 26 | 31 |
| Wastewater discharge (1,000㎥) | 8 | 13 | 15 |
| BOD (kg) | 59 | 58 | 15 |
| Nitrogen (kg) | 26 | 44 | 2 |
| Phosphorus (kg) | 10 | 9 | 3 |
Eisai Inc., Baltimore Plant (Maryland, U.S.) (FY)
*You can scroll to the left or right here
| 2022 | 2023 | 2024 | |
|---|---|---|---|
| GHG emissions | |||
| CO2 emissions (Scope1+2) (tons) | 926 | 474 | 469 |
| Energy consumption | |||
| Purchased electricity (MWh) | 5,426 | 4,185 | 2,810 |
| Natural gas (1,000㎥) | 485 | 249 | 238 |
| Waste treatment | |||
| Amount of waste generated (tons) | 16 | 38 | 21 |
| Recycled amount (tons) | 4 | 9 | 7 |
| Amount sent to landfill (tons) | 9 | 25 | 12 |
| Air pollutant emissions | |||
| SOx (kg) | 1,083 | 638 | -* |
| NOx (kg) | 812 | 496 | -* |
| Soot and dust (kg) | - | - | - |
| Environmental impact in wastewater | |||
| Water intake (1,000㎥) | 9 | 5 | 2 |
| Wastewater discharge (1,000㎥) | 9 | 5 | 2 |
| BOD (kg) | - | - | 1,436 |
| COD (kg) | - | - | 2,038 |
| Nitrogen (kg) | - | - | 242 |
| Phosphorus (kg) | - | - | 31 |
*:Not applicable from FY2024 due to relocation of the facility
G2D2 (Maryland, U.S.) (FY)
*You can scroll to the left or right here
| 2022 | 2023 | 2024 | |
|---|---|---|---|
| GHG emissions | |||
| CO2 emissions (Scope1+2) (tons) | 19 | 19 | 363 |
| Energy consumption | |||
| Purchased electricity (MWh) | 1,041 | 983 | 983 |
| Natural gas (1,000㎥) | 10 | 10 | 9 |
| Waste treatment | |||
| Amount of waste generated (tons) | 34 | 33 | 20 |
| Recycled amount (tons) | 18 | 19 | 13 |
| Amount sent to landfill (tons) | - | - | 0 |
| Environmental impact in wastewater | |||
| Water intake (1,000㎥) | 4 | 5 | 4 |
| Wastewater discharge (1,000㎥) | 4 | 5 | 4 |
Principal Chemical Substance Used (FY)
*You can scroll to the left or right here
| 2022 | 2023 | 2024 | |
|---|---|---|---|
| Suzhou Plant | |||
| Ethanol (tons) | 47.1 | 36.4 | 36.7 |
| Methanol (tons) | 0.7 | 0.7 | 0.6 |
| Acetonitrile (tons) | 0.7 | 0.6 | 0.5 |
| Benxi Plant | |||
| Ethanol (tons) | 8.3 | 9.6 | 8.5 |
| Sodium hydroxide (tons) | 0.6 | 3.5 | 2.5 |
| Hydrochloric acid (tons) | 1.0 | 1.3 | 0.7 |
| Bogor Plant | |||
| Methanol (tons) | 0.2 | 0.2 | 0.3 |
| Acetonitrile (tons) | 0.1 | 0.2 | 0.1 |
| Vizag Site | |||
| Methanol (tons) | 333.3 | 37.1 | 135.6 |
| Ethanol (tons) | 126.4 | 15.9 | 64.0 |
| Tetrahydrofuran (tons) | 32.4 | 4.0 | 53.4 |
| Acetonitrile (tons) | 0.0 | 5.0 | 32.9 |
| N,N-dimethylformamide (tons) | 28.4 | 0.6 | 21.0 |
| Acetone (tons) | 10.6 | 7.5 | 14.4 |
| Ethyl acetate (tons) | 10.4 | 6.2 | 11.9 |
| Concentrated hydrochloric acid (tons) | 43.4 | 0.2 | 10.9 |
| n-heptane (tons) | 1.9 | 2.8 | 7.9 |
| Sodium hydroxide (tons) | 1.9 | 0.4 | 3.2 |
| Dichloromethane (tons) | 3.0 | 0.4 | 0.6 |
| Glacial acetic acid (tons) | 0.1 | 0.0 | 0.5 |
| Dimethyl sulfoxide (tons) | 6.3 | 0.1 | 0.4 |
| EMEA Knowledge Centre | |||
| Acetonitrile (tons) | 0.4 | 0.3 | 0.3 |
| Methanol (tons) | 0.3 | 0.3 | 0.3 |
| Ethanol (tons) | 0.1 | 0.1 | 0.1 |
| Exton Site | |||
| Sodium hydroxide (tons) | 0.7 | 0.5 | 0.8 |
| Baltimore Plant | |||
| Dichloromethane (kg) | 278.6 | 174.7 | 259.4 |
| Petroleum ether (kg) | 80.0 | 29.9 | 78.0 |
| Anhydrous acetate (kg) | 25.0 | 19.5 | 38.8 |
| Anhydrous ether (kg) | 20.7 | 9.8 | 55.5 |
| Sebacic acid (kg) | 4.4 | 2.8 | 6.4 |
| G2D2 | |||
| Acetonitrile (kl) | 1.7 | 1.2 | 2.0 |
| Ethyl acetate (kl) | 1.2 | 1.3 | 1.3 |
| Heptane (kl) | 1.1 | 1.3 | 1.2 |
| Dichloromethane (kl) | 0.4 | 0.6 | 0.9 |
| Methyl-tert-butyl ether (kl) | 1.0 | 0.4 | 0.3 |
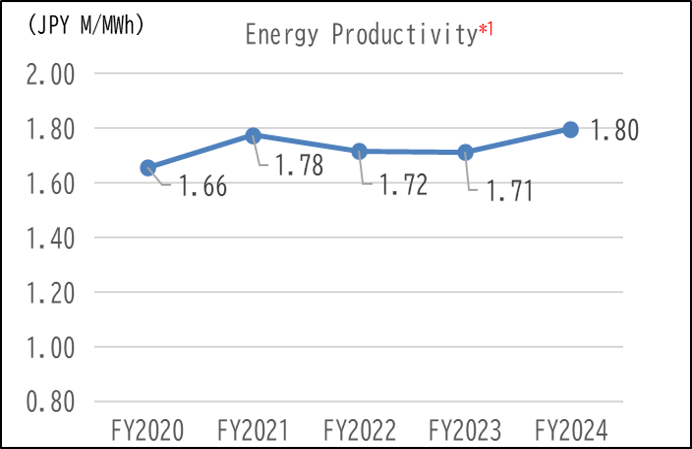
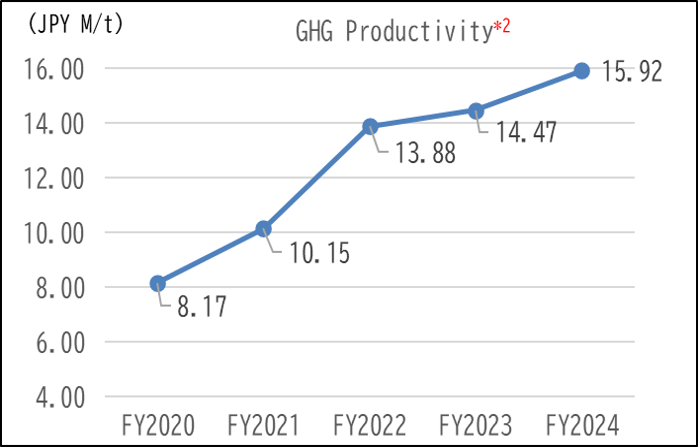
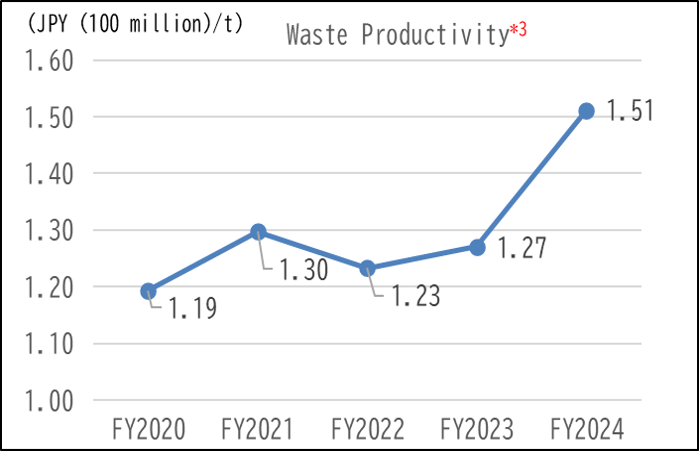
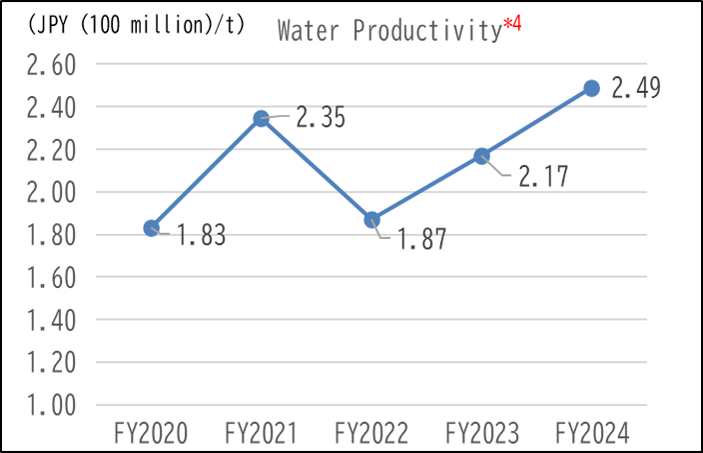
Sustainability-Related Indicators
-
*1
Net sales(million yen)/amount of energy used (MWh)
-
*2
Net Sales (million yen) /amount of CO2 emissions (tons)
-
*3
Net Sales (hundred million yen) /amount of waste generated (tons)
-
*4
Net sales (hundred million yen) /amount of water resources input (thousand ㎥)