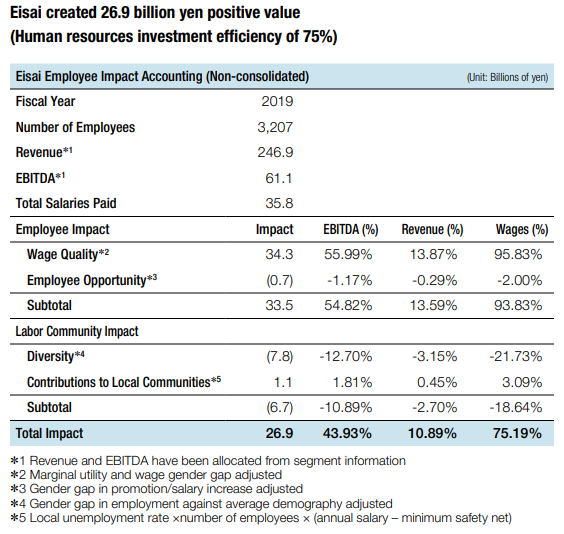
"Employee impact accounting" is an accounting method that shows how much of an impact the wages paid by a company to its employees have provides on society. "Human resource investment efficiency" is an indicator that shows the percentage of social impact over total salary (social impact / total salary), which is calculated using employee impact accounting.
Eisai calculated employee impact accounting and human resource investment efficiency and disclosed the results for fiscal 2019 in Eisai Value Creation Report 2021. Additionally, Eisai disclosed the targets for fiscal 2025 and 2030 in Eisai Value Creation Report 2023.The details are as follows.
Ⅰ. Results for fiscal 2019
Dr. Ryohei Yanagi, Eisai’s CFO at that time, and a team led by George Serafeim, a professor at Harvard Business School (HBS) calculated Eisai's "Employee impact accounting" for fiscal year 2019 as the first case study of Impact-Weighted Accounts Initiative (IWAI) in Japan*1*2.
- *1Source: Ryohei Yanagi, “Monthly Capital Market” September 2021 issue, “Disclosure in the integrated report of employee impact accounting”
- *2Assumptions behind Eisai's calculations for "Employee Impact Accounting" are as follows.
- This calculation is only for Eisai Co., Ltd. (Japan) and does not include employees of subsidiaries overseas. The reference date is the end of 2019. The total number of employees is 3,207, the total annual salary payment annualized based on December standards is 35.8 billion yen, and the theoretical average annual salary is 11.148 million yen. This figure annualized based on the end of December does not strictly match the average annual salary based on the end of March disclosed in the fiscal 2019 securities report, but it is roughly at the same level.
- Revenue and EBITDA for Eisai Co., Ltd. are allocated at a certain ratio from segment information. This does not match figures disclosed at Eisai's official nonconsolidated financial statements. While the parent company in Japan recognizes a large amount of milestone revenue from its partners, it reimburses research and development expenses of overseas subsidiaries. These special accounting procedures have a significant impact on the official financial statements, therefore "theoretical ability value" is estimated from segment information.
1. Employee Impact
1) Wage quality (34.3 billion yen)
Wage quality isn’t the total salary but is adjusted for the marginal utility based on the annual income and wage gender gap between men and women.
HBS calculated Eisai's employee satisfaction and found that the saturation point for employee salary satisfaction was 11.9 million yen (weighted average). In other words, reduction of value creation is applied for employees with annual incomes higher than this point, based on the law of diminishing marginal utility (the higher the annual income, the lower the satisfaction level, not 100%).
In addition, the wage gender gap between men and women is calculated by hierarchy and position, and an adjustment is made by deducting the portion where the average salary of women is lower than that of men*3.
As a result, "Wage Quality" that creates a social impact was 34.3 billion yen whereas the total salary amount was 35.8 billion yen.
- *3Eisai's wage gender gap between men and women is relatively smaller than the average in Japanese companies. For example, while female middle managers earn 89% of the wages of men on average in Japanese companies, female middle managers earn 96% of the wages of men in Eisai.
2) Employee opportunity (-0.7 billion yen)
Employee opportunity is adjusted for the gender gap in promotions and salary increases. The gender ratio by jog function and class was calculated, and the gap was deducted by equalizing promotions and salary increases so that the ratio of female in management*4 would be 23%, the ratio of female employees across Eisai at that time. As a result, the social impact was reduced by 0.7 billion yen.
- *4At the time of calculation, the ratio of woman in management across Eisai was 10%.
2. Labor Community Impact
1) Diversity (-7.8 billion yen)
Diversity is adjusted for the gender ratio in Japan compared to Eisai’s workforce. This adjustment assumes that 909 employees are newly hired at the entry level for the shortage to increase Eisai's female employee ratio to 51%, the female population ratio in Japan. As a result, the social impact was reduced by 7.8 billion yen*5.
- *5Shortage of 909 female employees × 8,549 thousand yen of average annual salary at entry level of,000 yen = 7.8 billion yen
2) Contributions to local communities (+1.1 billion yen)
Contribution to local communities is an estimate of the social impact created by the employment of Eisai employees in the local community. It is calculated by multiplying the unemployment rate in each prefecture where Eisai employees work, the number of Eisai employees, and the gap between Eisai's average annual salary and the minimum living wage in each prefecture. As a result, the social impact was added by 1.1 billion yen.
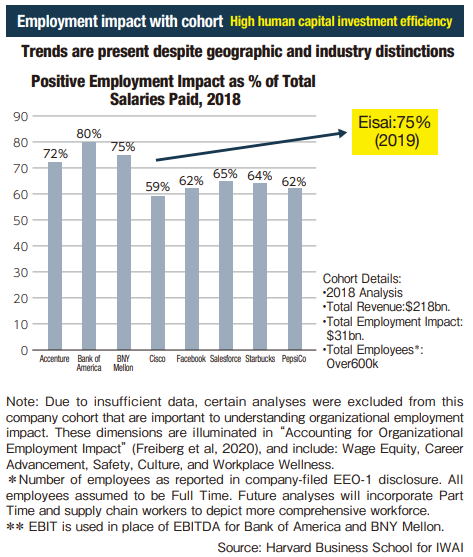
As a result of these additions and subtractions, 26.9 billion yen of Eisai’s nonconsolidated total payroll of 35.8 billion yen for fiscal 2019 was recognized as “creating positive social impact”. Human resource investment efficiency was 75% (26.9 billion yen / total payroll of 35.8 billion yen), which is favorably compared with scores of blue-chip companies in the U.S., calculated by HBS.


Ⅱ. Targets for fiscal 2025 and 2030
Eisai’s human resource investment efficiency in fiscal 2019 showed favorable results. On the other hand, it also showed that there were issues with diversity-related indicators. As a result of initiatives to address these issues, the score was improved to 80%*6 in fiscal 2022 and 81%*6 in fiscal 2023, but our effort is still on the way.
We will proactively take initiatives to improve the ratio of female employees, the ratio of female managers, and the number of female appointments to organizational heads with the aim of achieving improvement to 82% in fiscal 2025 and 87% in fiscal 2030.
| Fiscal 2019 results |
Fiscal 2022 results*6 |
Fiscal 2023 results*6 |
Fiscal 2025 target |
Fiscal 2030 target |
|
|---|---|---|---|---|---|
| Human resource investment efficiency | 75% | 80% | 81% | 82% | 87% |
- *6Internal estimation
